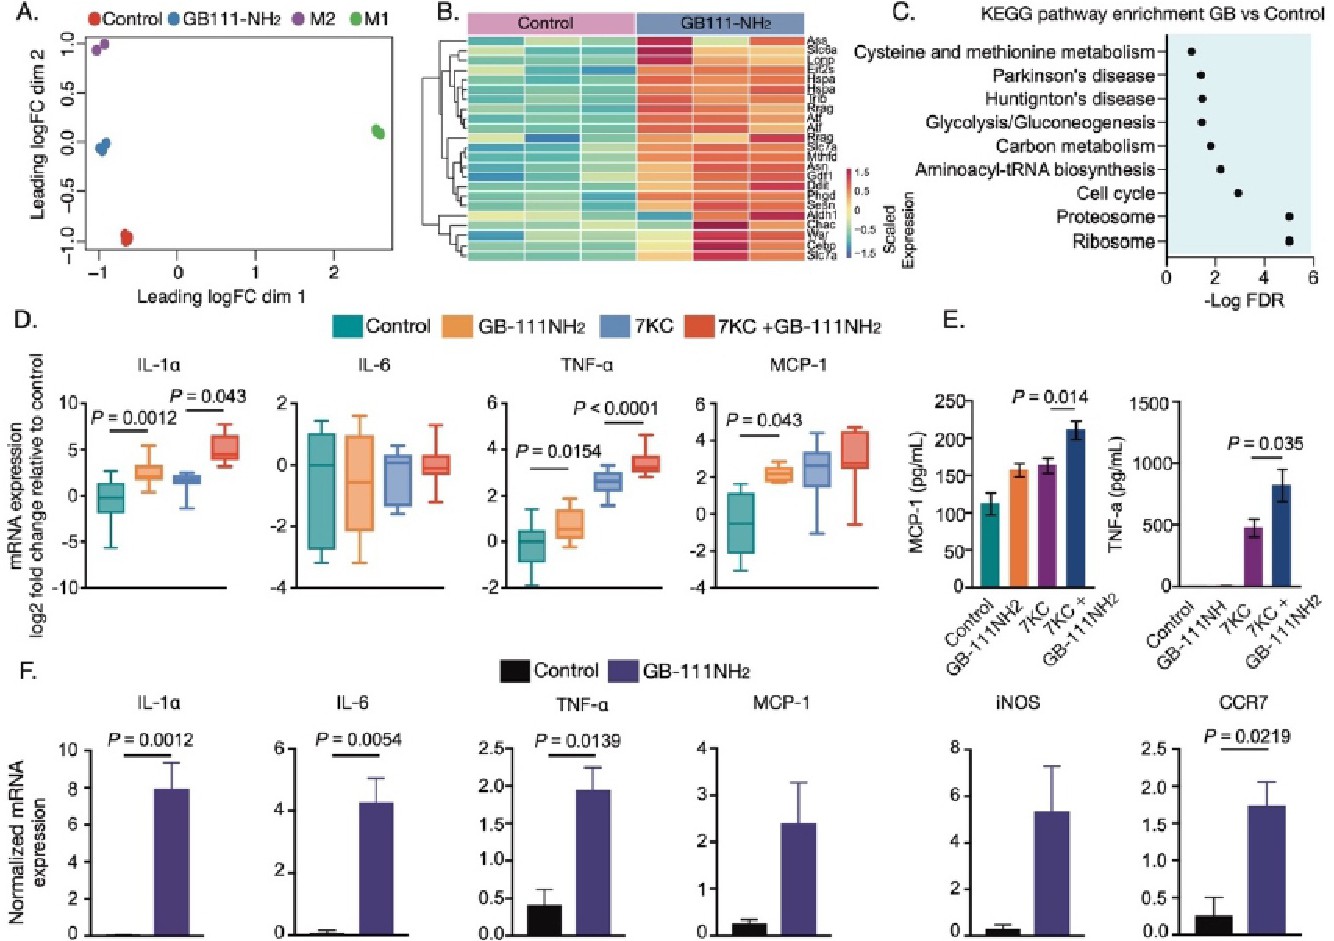
Fig. 6. Loss of cathepsin function promotes pro-inflammatory phenotype in macrophages. BMDMs were treated with GB111-NH2 or DMSO for 16h or IL-4 for 24 h to induce the M2 phenotype, or LPS/IFN-γ for 24 h to generate the M1 phenotype. (A) Multi-Dimensional Scaling (MDS) plot from RNA-seq data showing distances between groups on a two-dimensional scale (n=3 biological replicates). (B) A heat-map presenting expression of stress related genes in GB111-NH2 and DMSO vehicle treated BMDMs, as described in panel (A). (C) Gene Set Enrichment Analysis (GSEA) of KEGG pathways showing enriched gene sets in GB111-NH2 treated BMDMs compared to DMSO controls. (D) BMDMs pre-treated with GB111-NH2 or DMSO for 16 h were further stimulated with 7-Keto or vehicle for an additional 4 h (n=10-15 biological replicates from five independent experiments). The box and whisker plot presents log2 fold changes compared to DMSO controls. The data are summarized over 15 biological samples per condition. The Kruskal-Wallis test was used to compute statistical significance. (E) Secretion of inflammatory cytokines is exacerbated by cathepsin inhibition upon stimulation with oxidized lipids. MCP-1 and TNF-α levels were determined by ELISA from the supernatant of BMDM cultured with different stimuli. The data were summarized from two independent experiments with 6 biological replicates. One-way ANOVA with Sidak's post hoc correction for multiple comparisons was used to evaluate the statistical difference between treatments. (F) Expression of inflammatory genes due to cathepsin inhibition in human primary macrophages (n=3 biological replicates). Macrophages were treated with GB111-NH2 for 24h or with DMSO control. Normalized expressions of inflammatory genes are presented in bar graphs. Two-tailed Student's t-test was used to evaluate the statistical difference. Bar graphs present the mean ± SEM, and box and whiskers plot.